005 :EDA & T-student test
Summary
This project involves a comprehensive data analysis of taxi shared trips and their locations. The goal is
to explore business characteristics, test hypotheses, and identify patterns in the data using statistical
analysis and visualization techniques.
The dataset includes information about businesses, their locations, and a series of hypotheses to be
explored. This project leverages statistical analysis tools and data visualization to validate hypotheses
and extract meaningful insights.
Analysis Structure
1. Data Import and Validation
- Data is loaded from multiple sources and its initial structure is examined.
- The dataset is checked for consistency, including variable types and missing values.
2. Exploratory Data Analysis (EDA)
- The dataset's characteristics are analyzed to understand variable distributions and relationships.
- Interactive visualizations using `plotly` are employed to explore geographic and categorical patterns in
business data.
3. Statistical Analysis
- Tools from `scipy` are used to conduct statistical tests on the hypotheses presented in the dataset.
- Statistical tests provide deeper insights into business characteristics and validate hypotheses.
4. Conclusions
- The analysis concludes with a summary of key findings, including patterns in business locations and the
validation of proposed hypotheses.
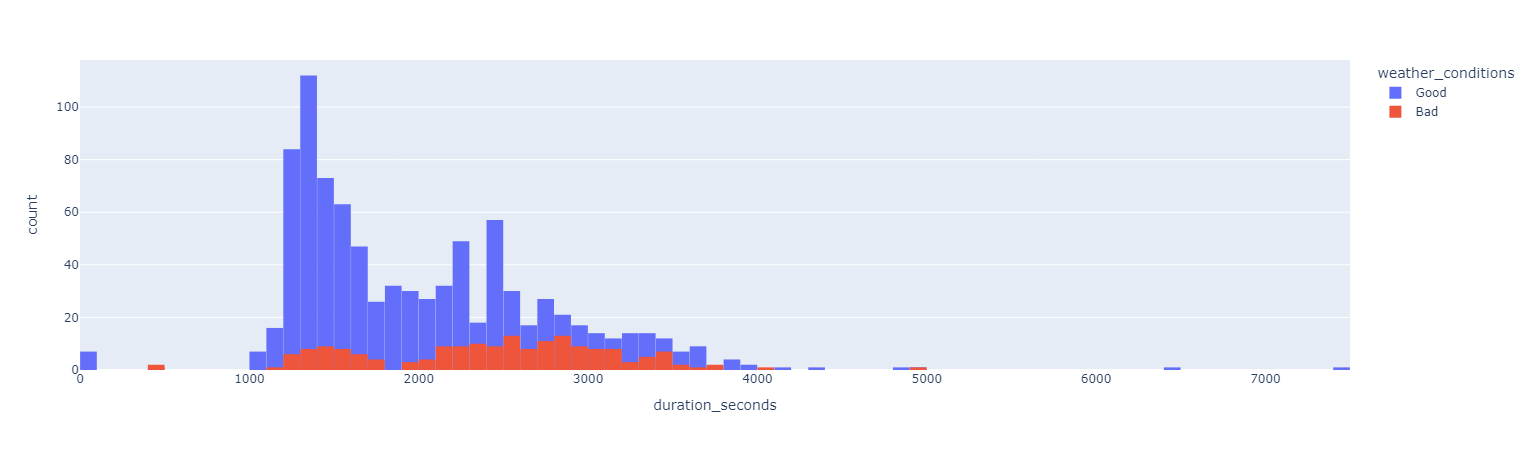
Travels histogram
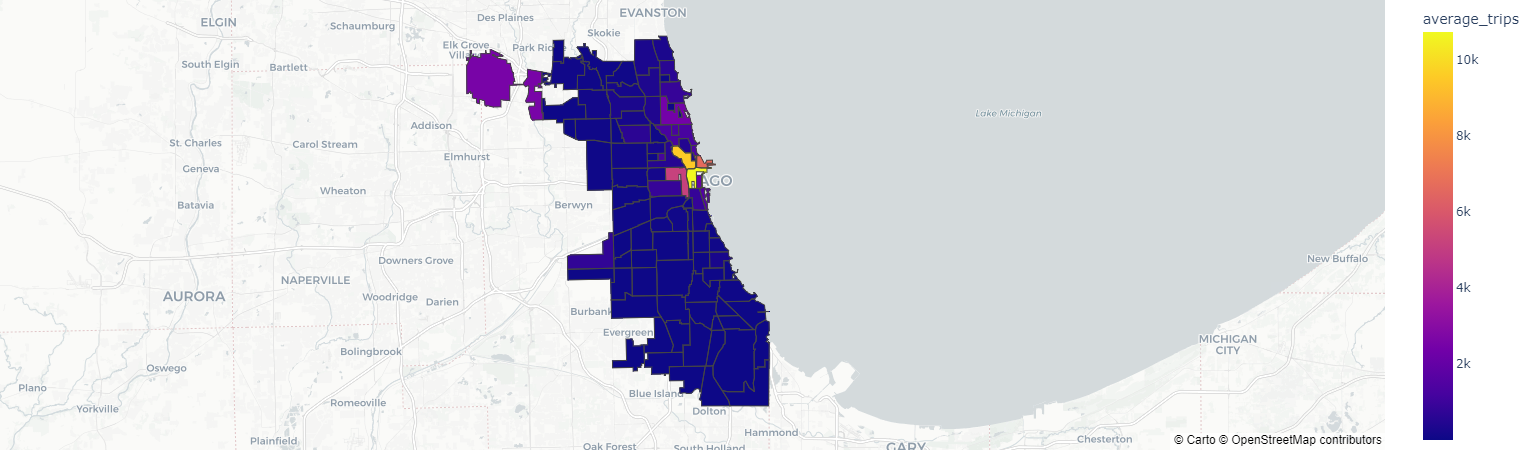
Heatmap of travels
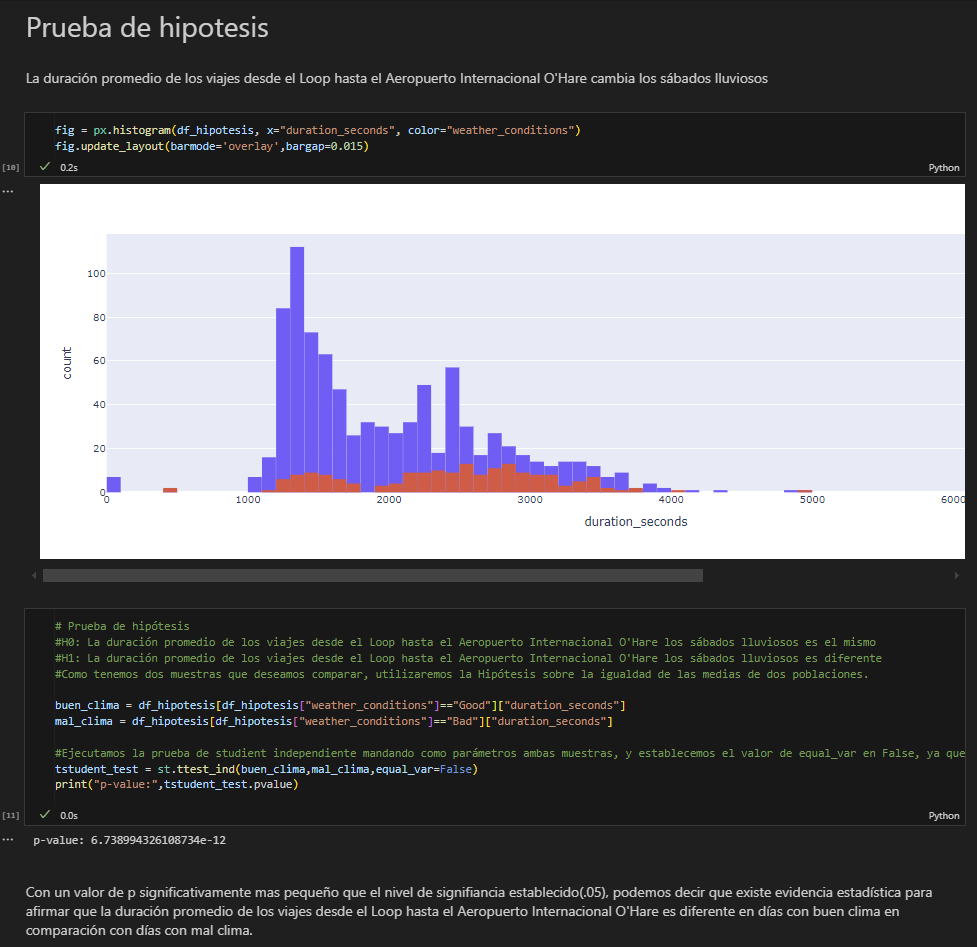
Hypotesis test